Cannabis Deficiencies
Diagnose Cannabis Nutrient Deficiencies & Toxicity In Plants

While nutrients are crucial to your plant's health and well-being, they must be present in the proper amount. An overabundance of lack of any nutrient can prevent your plant from reaching its maximum potential. Here are some of the most common nutrient deficiencies in plants, and how to diagnose them.
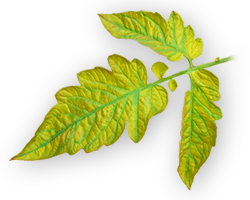
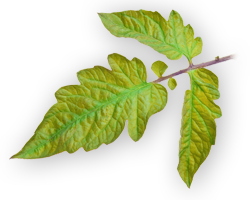
Nitrogen Deficiency
- Pale green or yellow leaves
- Not enough chlorophyll
- Symptoms begin in lower leaves
- Very slow growth
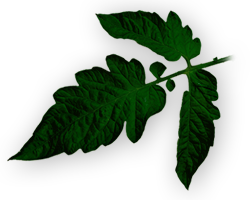
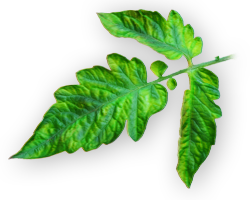
Nitrogen Toxicity
- Dark green leaves and foliage
- Leaf tips may turn down without signs of overwatering
- Weak stems
- Slow growth
- Cupping, curling or "clawing" leaves
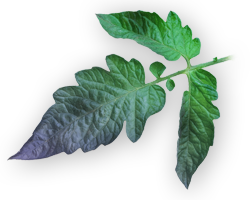
Phosphorus Deficiency
- Purple/Blue tinge to leaves
- Stunted growth
- Possible purple spots
- Small and potentially foul tasting, smelly fruits and vegetables
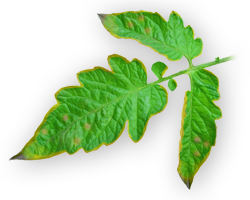
Potassium Deficiency
- Brown scorching and curling of leaf tips
- Chlorosis (abnormally yellow color of plant tissues)
- Possible purple spots
- Plant growth, root development, seed and fruit development greatly reduced
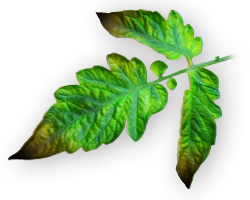
Magnesium Deficiency
- Chlorosis (abnormally yellow color of plant tissues)
- Leaves have a marbled appearance
- Symptoms appear in older leaves
- Necrosis and dropping of older leaves
- Very small fruits and flowers
Sulfur Deficiency
- Uniform pale green chlorosis
- Purple vein color
- Purple and reddish pigmentation
- Severe stunting, reduced size, and less branching
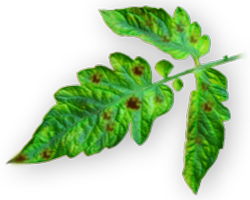
Manganese Deficiency
- Leaves yellow between veins
- Dead spots on severely affected leaves
- Stunted growth
- Severe deficiency may resemble severe magnesium deficiency
Zinc Deficiency
- Interveinal chlorosis of young leaves
- New leaves thin and wispy
- Leaf tips turn black and die
- New bud and leaf growth stop

Give Us A Shout
Gardening Feeding Schedule
FEEDING SCHEDULE - TEASPOONS/GALLON
SOIL APPLICATIONS
WELL-ROOTED CLONES OR SEEDLINGS |
VEGETATIVE STAGE |
FLOWER STAGE |
||||||||||||
|---|---|---|---|---|---|---|---|---|---|---|---|---|---|---|
|
Week1 |
Week2 |
Week1 |
Week2 |
Week3 |
Week4* |
Week1 |
Week2 |
Week3 |
Week4 |
Week5 |
Week6 |
Week7 |
Week8** |
|
|
EC (mS/cm) |
0.9EC |
0.9EC |
1.8EC |
1.8EC |
2.2EC |
2.4EC |
2.3EC |
2.6EC |
2.6EC |
2.8EC |
2.8EC |
2.8EC |
2.1EC |
0.3EC |
|
PPM (500 scale) |
430 ppm |
430 ppm |
900 ppm |
900 ppm |
1100 ppm |
1200 ppm |
1150 ppm |
1300 ppm |
1300 ppm |
1400 ppm |
1400 ppm |
1400 ppm |
1050 ppm |
140 ppm |
|
GROW Powder |
0.75 tsp |
0.75 tsp |
1.5 tsp |
1.5 tsp |
1.75 tsp |
2.0 tsp |
0.75 tsp |
|||||||
|
CAL/MAG Powder |
0.5 tsp |
0.5 tsp |
0.5 tsp |
0.5 tsp |
||||||||||
|
BLOOM Powder |
1.0 tsp |
1.25 tsp |
1.5 tsp |
1.5 tsp |
1.5 tsp |
1.5 tsp |
1.5 tsp |
|||||||
|
BOOST Powder |
0.5 tsp 3.5g |
0.5 tsp 3.5g |
0.5 tsp 3.5g |
0.5 tsp 3.5g |
0.5 tsp 3.5g |
|||||||||
|
CARBOFLUSH Powder |
0.75 tsp 2.3g |
0.75 tsp 2.3g |
||||||||||||
Parts per million (ppm) values are calculated on base water treated with a reverse osmosis filter at 0ppm.
*For extended VEG cycles, repeat week 4 of VEG table.
**For extended Flower cycles, repeat week 6 of the Flower chart for any additional weeks added, making sure to follow week 7 and 8 the final two weeks of Flower.
NOTE:
For light feeding plants/gardens with lower light intensity/no CO2- Adjust down as much as 30%
For heavy feeding plants/high light intensity rooms/high CO2- Adjust up as much as 20%